Alert analytics
Track alerts with detailed insights and metrics on alert frequency
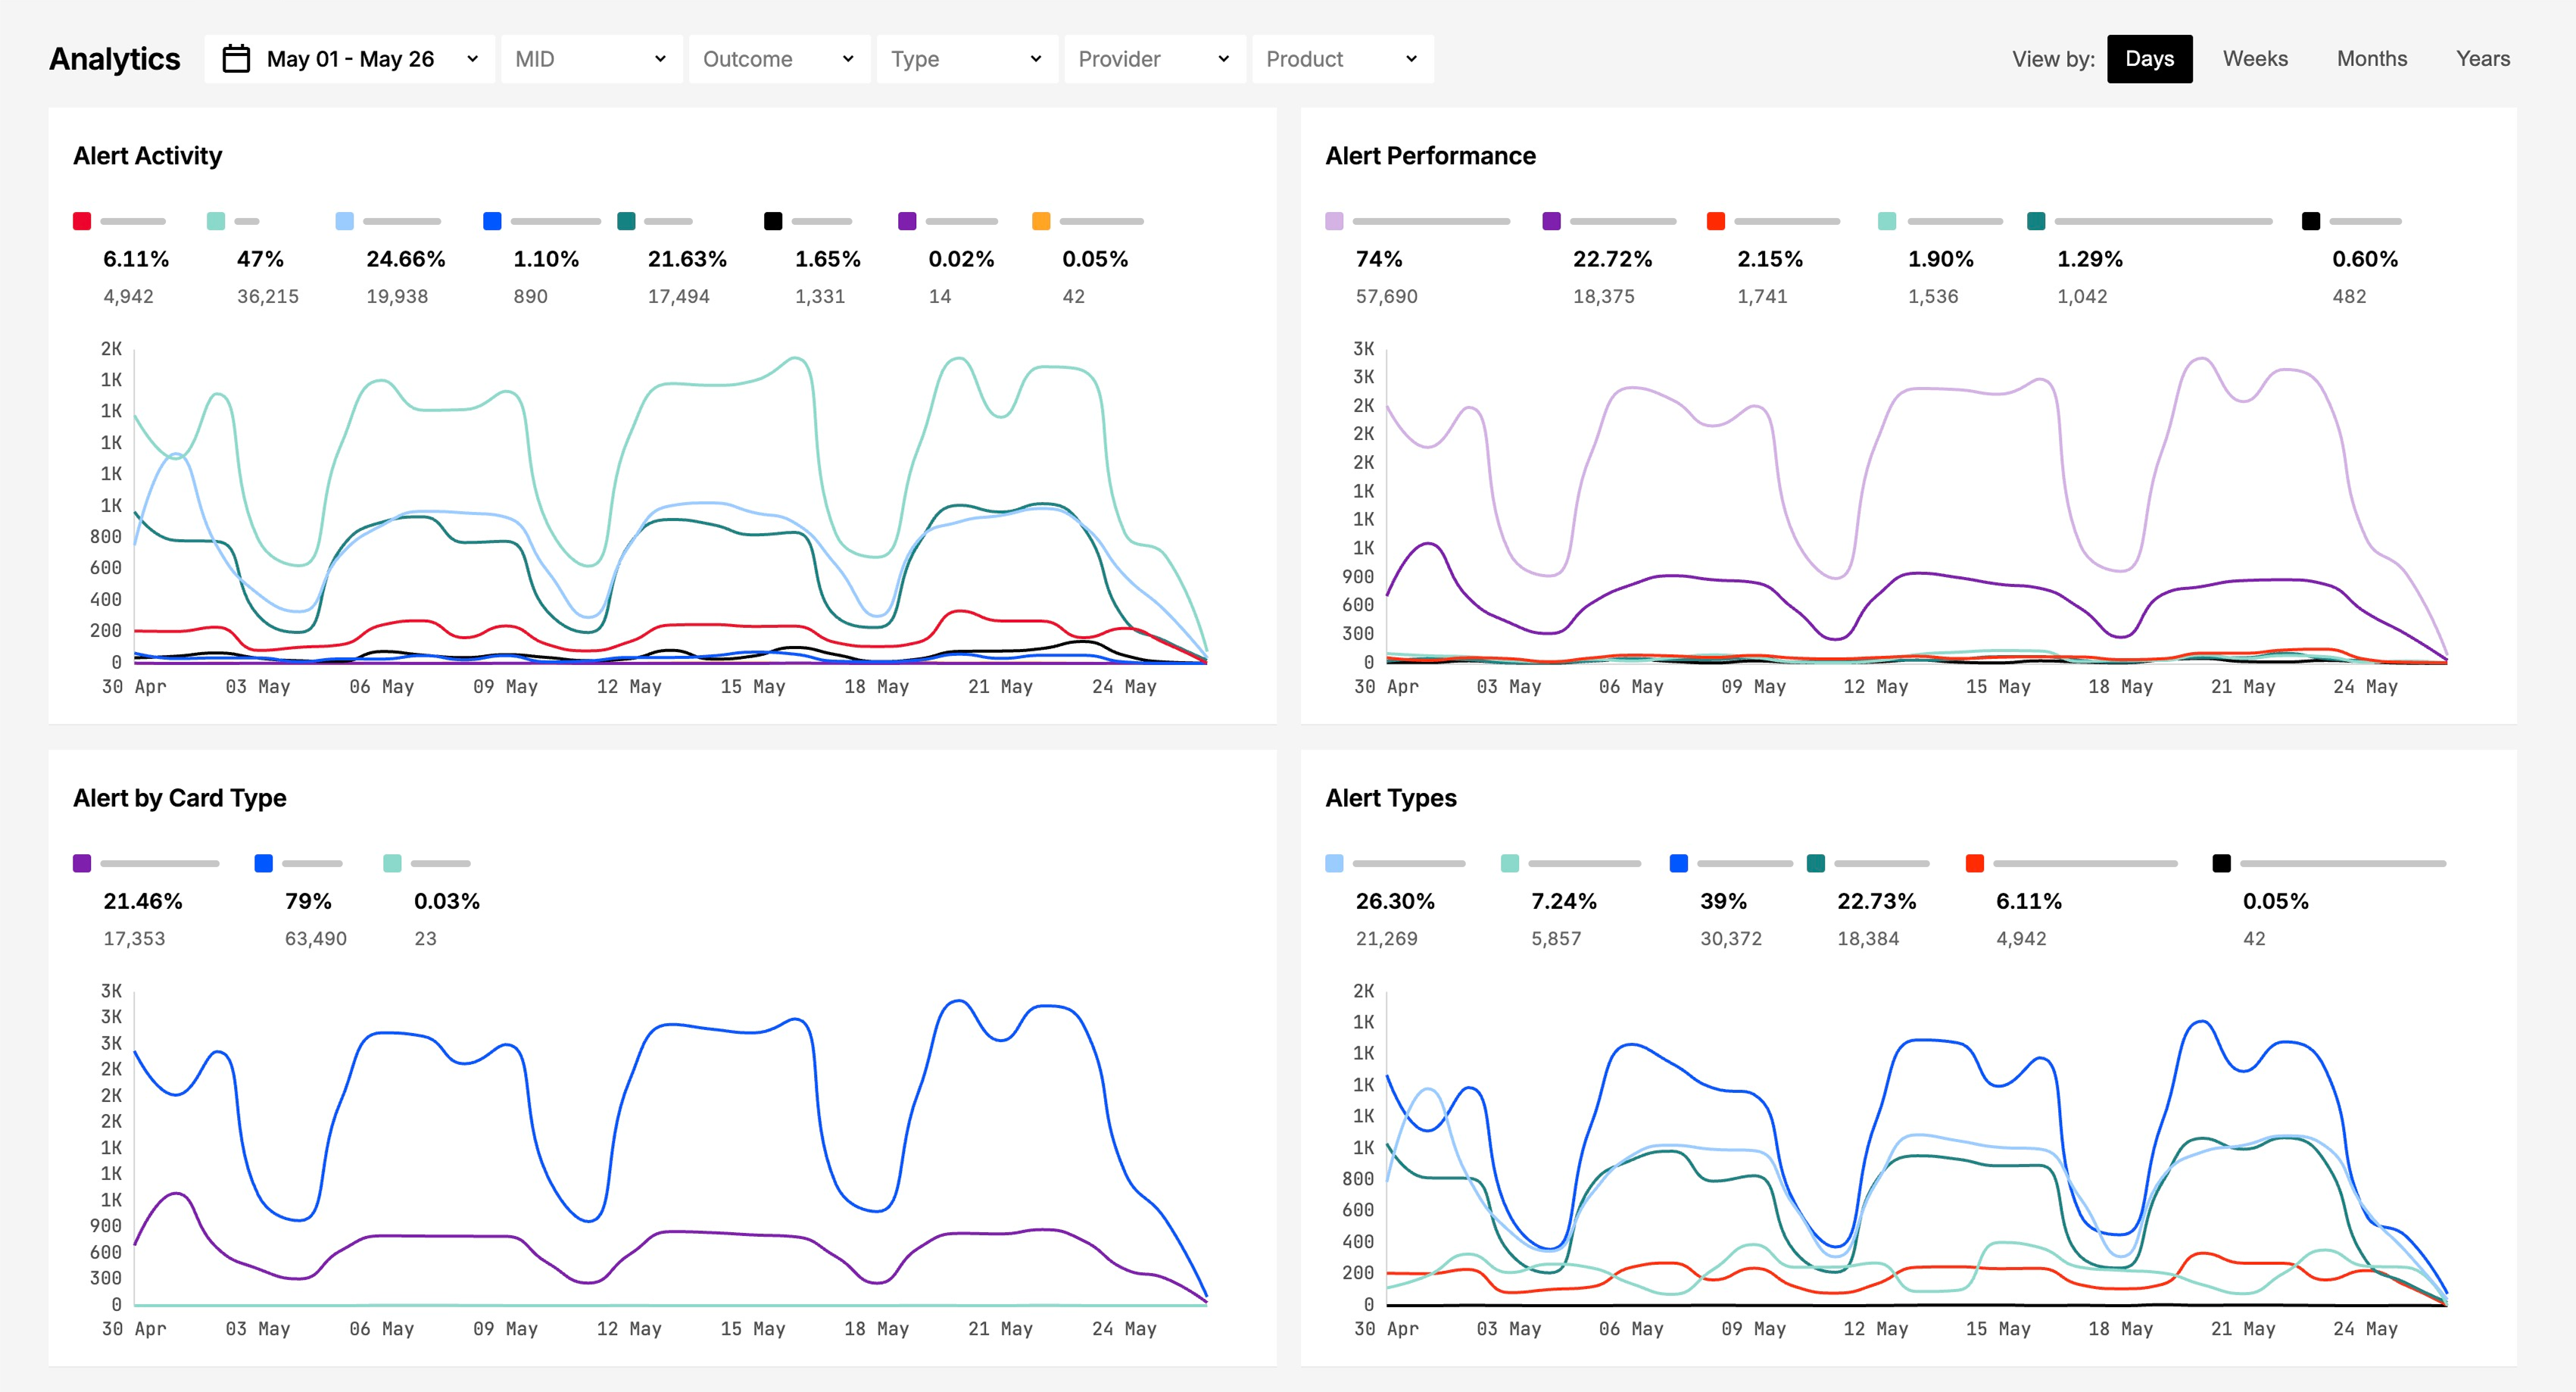
Chargebackhit HUB Alert analytics provides visibility into alert activity across your MIDs, products, and providers. The dashboard helps you track alert volume, distribution by type and card brand, and performance trends over time.
All metrics reflect the selected filters and date range.
Filters block
The filters block controls which alerts are included in analytics calculations.
Available filters include:
- Guide
The section provides an interface for managing MIDs, with capabilities for detailed inspection, data modification, filtering, and exporting. MID
Filter by specific merchant identifiers added to the system. - Guide
A chargeback is the process by which the issuing bank debits the merchant's account to return it to the cardholder. Outcome
Filter by alert outcome status, such as refunded, declined, and others. - Guide
Alert types categorize different stages and actions within dispute processing. Type
Filter by alert type or Inform category. - Guide
Prevent disputes and protect revenue with real-time transaction insights. Provider
Filter by the entity responsible for processing the alert. - Guide
Product guides offer insights for using the system to monitor and reduce chargeback risk. Product
Filter by product associated with the transaction. - Date range
Set date range to analyze disputes for a specific time period. - Aggregation interval
View data grouped by day, week, month, or quarter.
Filters support multi-selection and apply to all charts on the dashboard.
Dashboard charts
The dashboard displays several charts to analyze alert patterns:
- Alert activity
Tracks alert volume over time, grouped by product. Each line represents a different product. Hover to view the alert count, percentage of total, and product name. - Alert by card type
Displays alert distribution by card brand. Hover over the chart to see alert count, share of total, and brand name. - Alert types
Shows alert volume by alert type. Hover to view alert count, percentage, and type name. - Alert performance
Visualizes alert outcomes as proportional segments. Larger segments indicate higher volumes. Hover to display a breakdown table sorted by volume (descending).
The Other category always appears last. - Alert providers
Shows alert volume by provider. Hover to view alert count, share of total, and provider name.
MIDs analytics
Lists active MIDs, arranged in descending order based on the number of alerts for the selected period. Use this section to identify high-volume MIDs that may require attention.
Looking for help? Contact us
Stay informed with Changelog