Dispute analytics
Track dispute volume, recovery, and representment results
Chargebackhit HUB Dispute analytics provides visibility into dispute activity and representment performance across your payment providers. The dashboard helps you track dispute volume, challenged disputes, recovery efficiency, and trends over time.
All metrics reflect the selected filters and date range.
Filters block
The filters block controls which disputes are included in analytics calculations.
Available filters include:
- Payment method
Select APM or Card to view analytics based on the payment method. - Guide
Connect payment providers to automate alert management. Integration
Select a payment provider, such as PayPal when you set APM. - Date range
Set date range to analyze disputes for a specific time period. - Aggregation interval
View data grouped by day, week, month, or quarter.
Filters apply to all charts on the page.
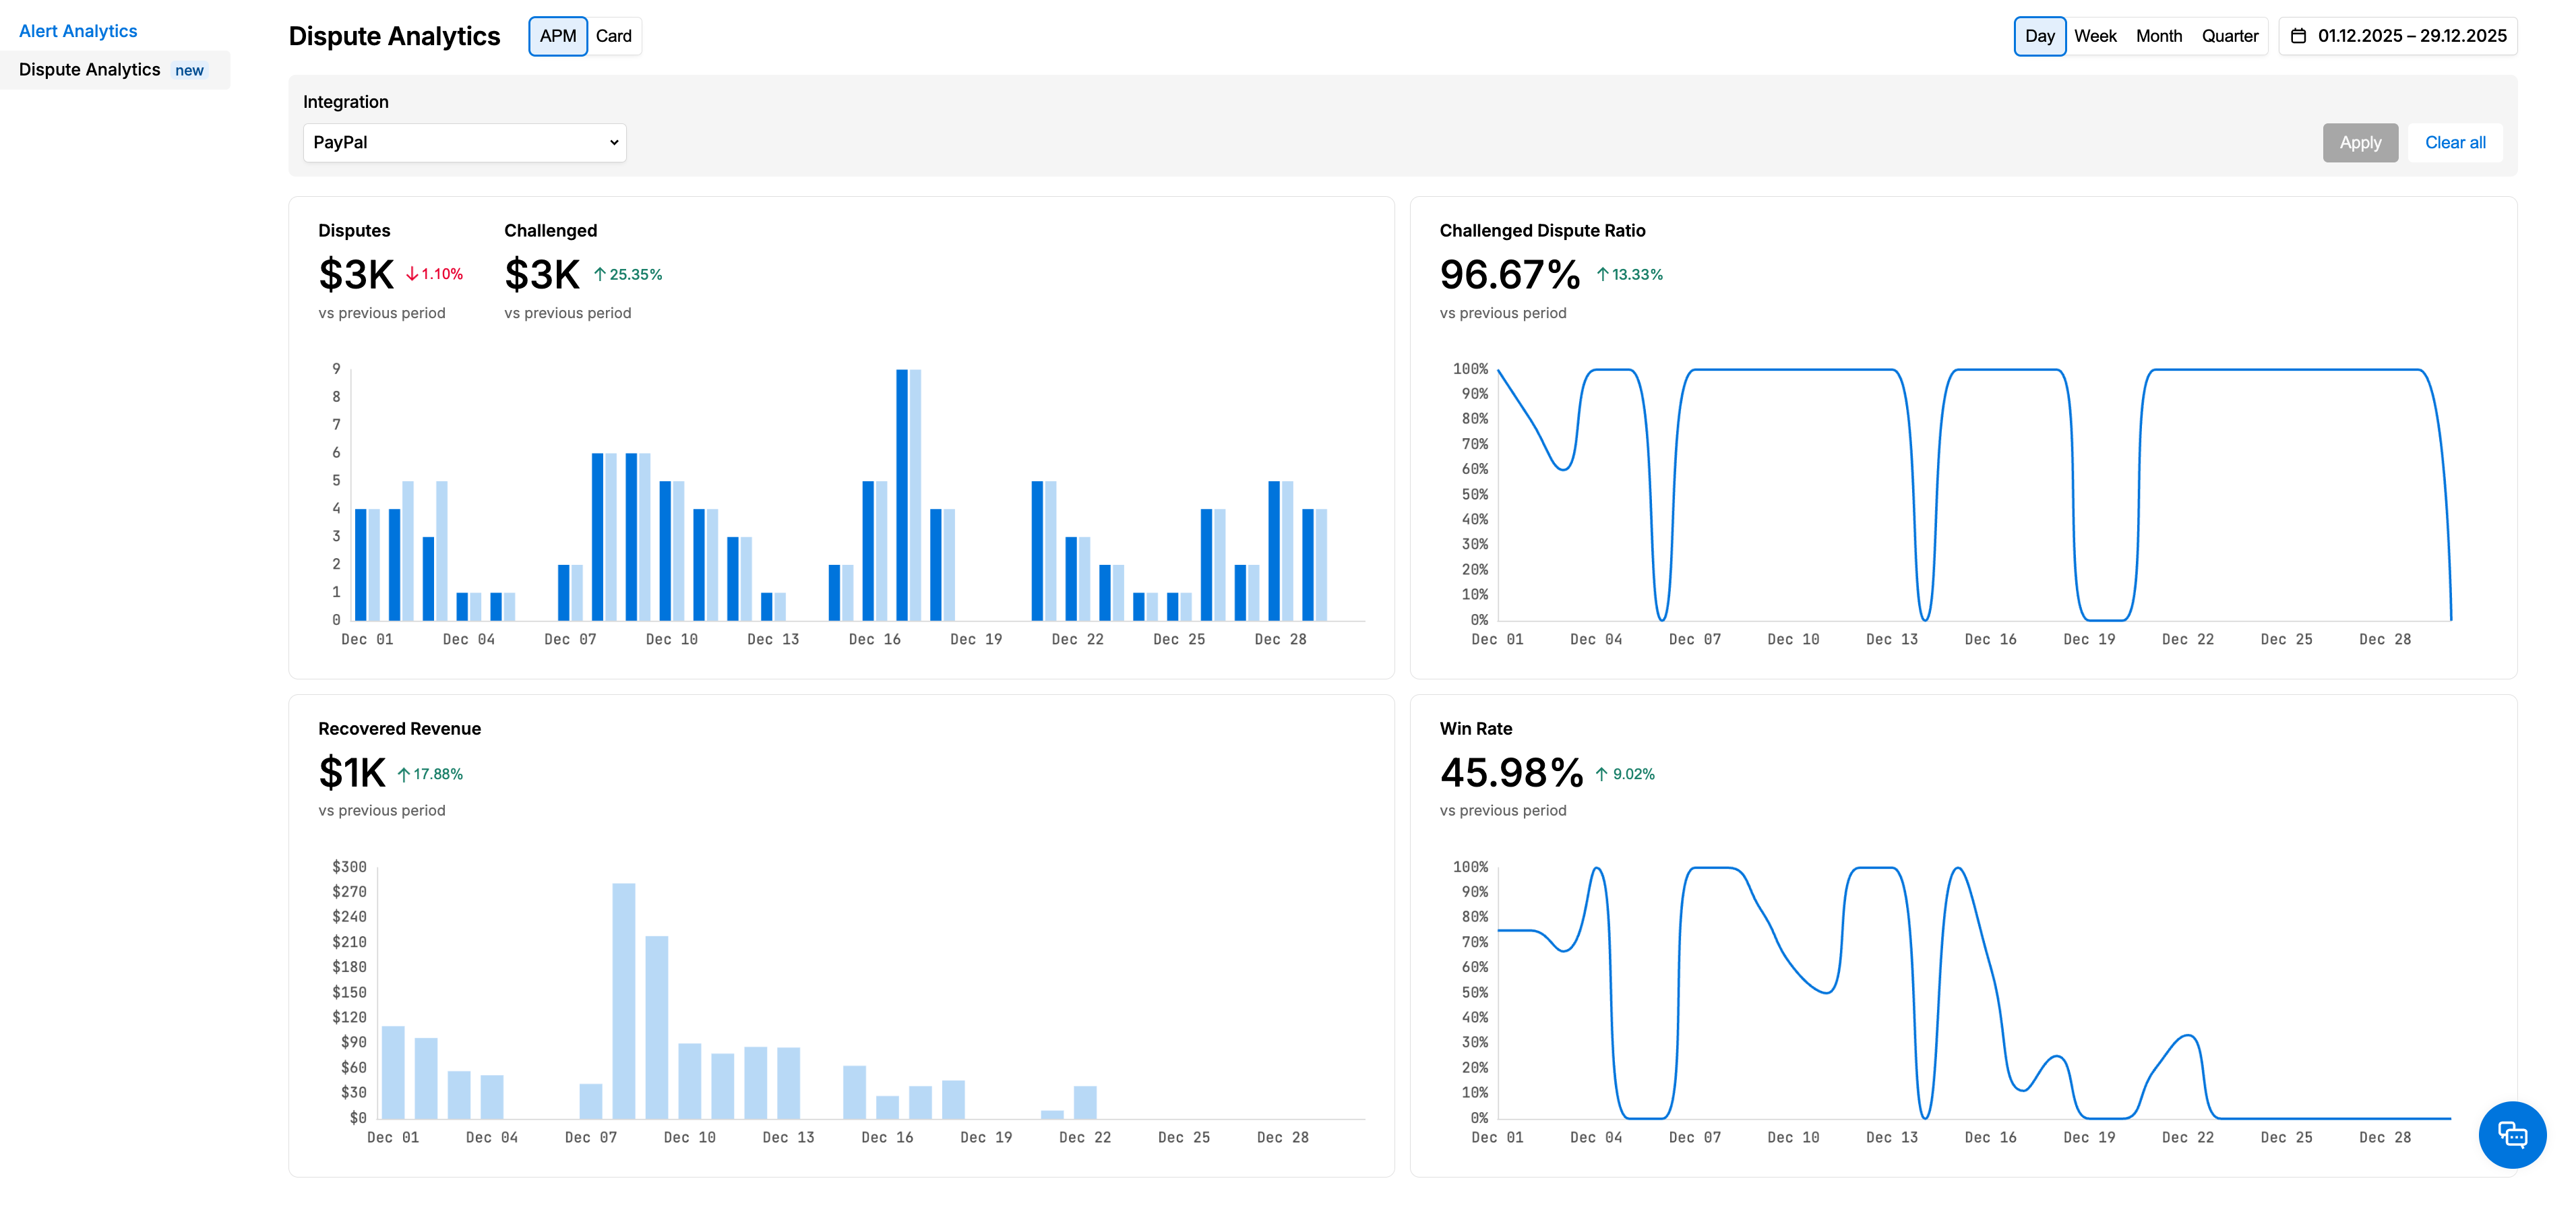
Dashboard charts
The charts show how dispute volume and representment activity change over time, and each metric includes a comparison with the previous period:
- Disputes and Challenged
Displays the total disputed transaction amount and the challenged amount submitted for representment. Bars show the selected aggregation period, and hovering over a bar reveals exact values for a specific date, the count of disputes and corresponding amount. - Challenged dispute ratio
Shows how many disputes were challenged compared to all disputes received. - Recovered revenue
Shows total wins or the amount returned to your business after successful dispute outcomes. - Win rate
Represents the percentage of resolved disputes with a successful outcome. When hovering, you can see the percentage and number of won and challenged disputes.
Line charts help identify trends, spikes, and drops in performance.
Looking for help? Contact us
Stay informed with Changelog